Reporting is one of the key functions of being able to utilise the data held within Radar, to understand not only how your marketing is working, but also how ALL of your business is contributing to your overall performance.
Within Reports you have two separate types of reporting to choose from:
- Datasets - View the Data by pulling your requirements into fields
- Crosstabs - set up in a similar way to pivot tables in Excel, to be able to summarise data into a table
Core groups will be available within Radar, based on how your data has been grouped, these are available to view under Sources and Fields.
We can then add to these as needed - raise a Freshdesk ticket for any new requests and we can action these on your behalf as long as the data is available!
Creating a Report using Datasets
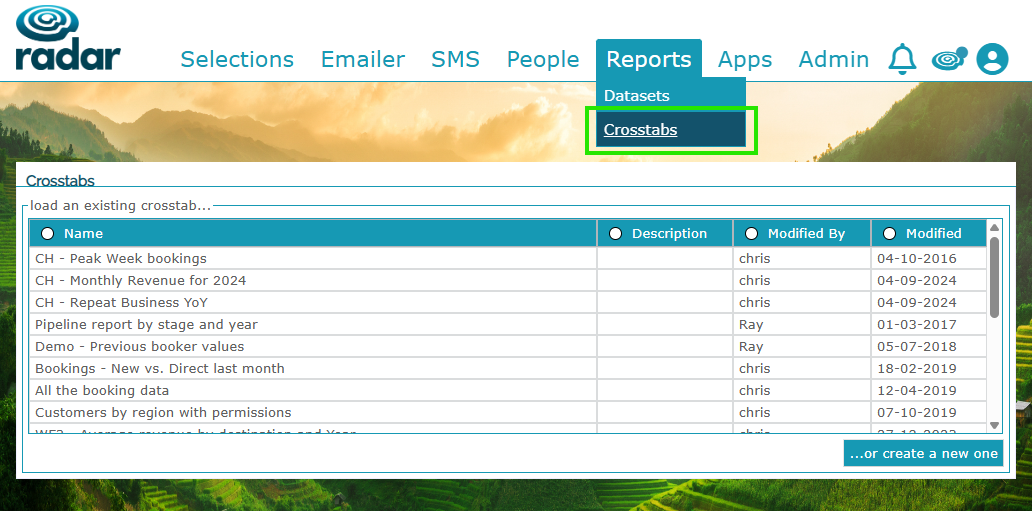
Your saved reports will be available in the initial window list and these can be edited and resaved as needed, but you can also create a new report by ...or create a new one.
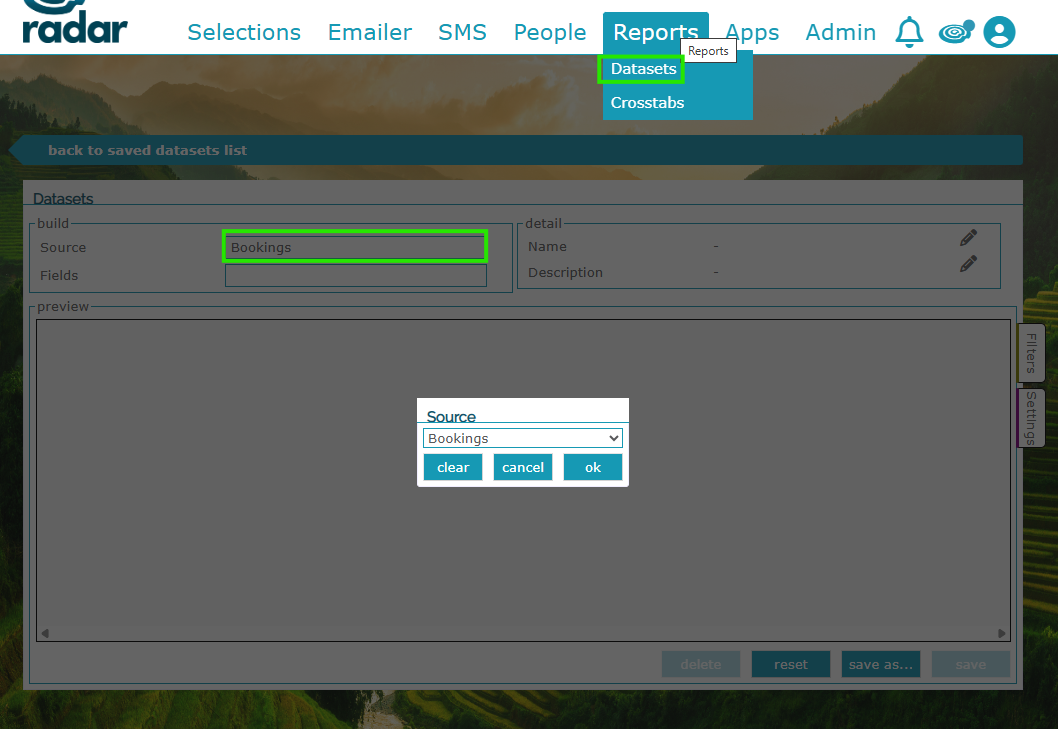
You can then choose your source for the report - for example 'Bookings' and pull data from this grouping:
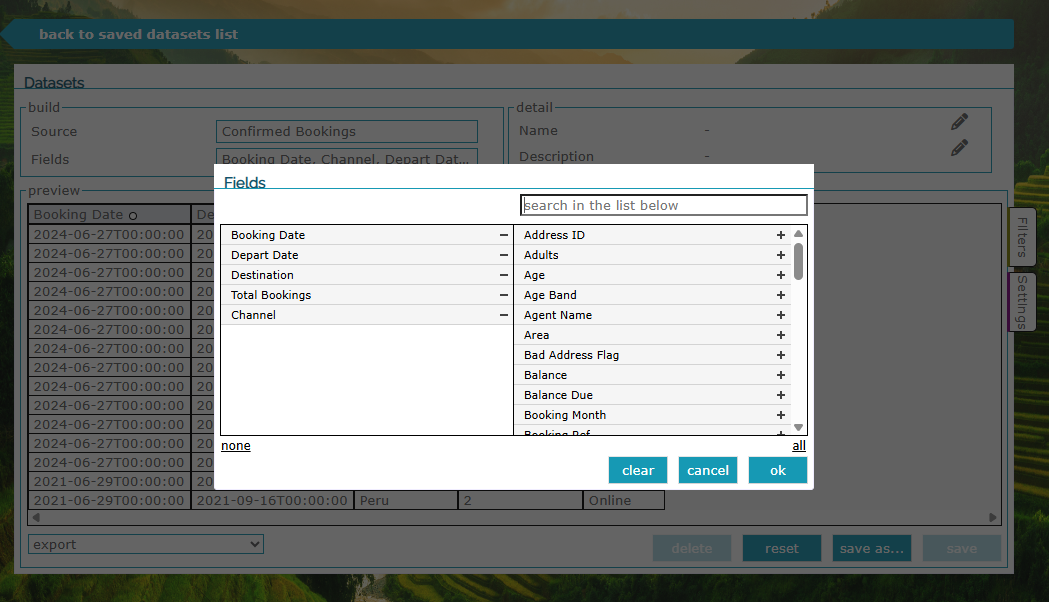
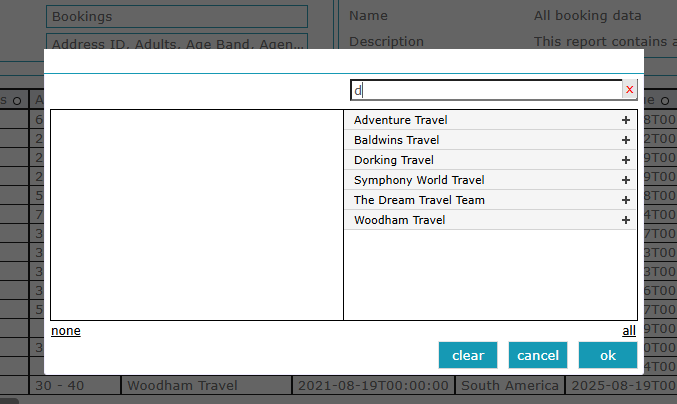
You can then choose the fields you'd like data to be shown for from that Source:
Once you've added all of the data you'd like, you can then click OK and compile that report:
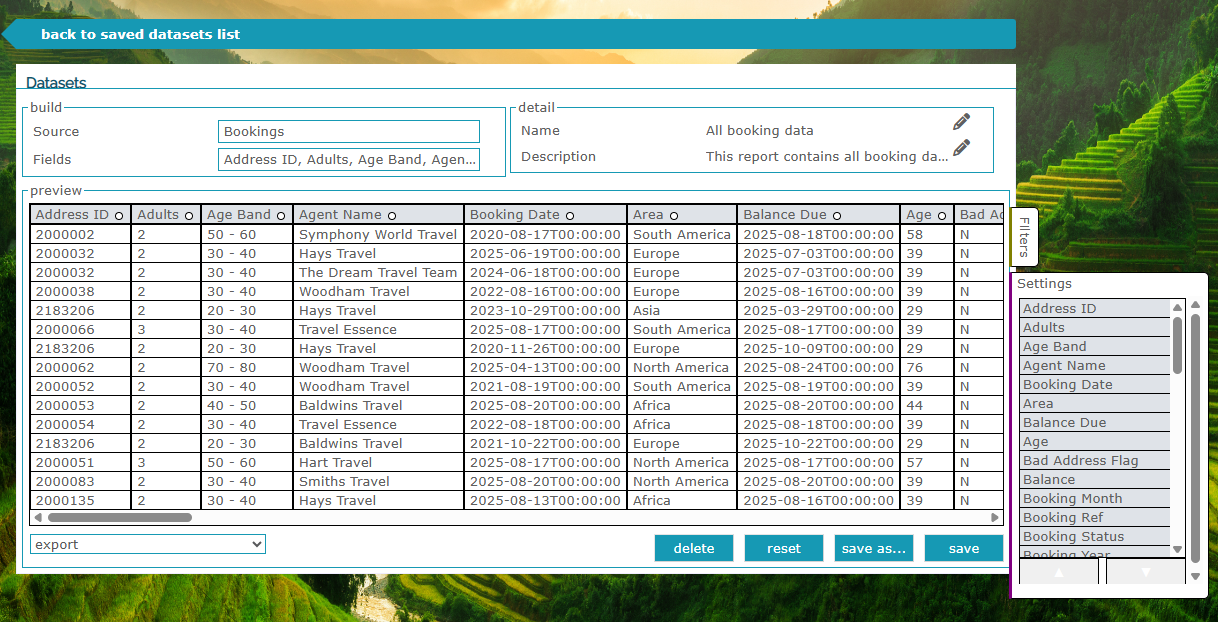
Once you have this report, you can move the data columns around as well as being able to filter and search within the data using the Feed boxes: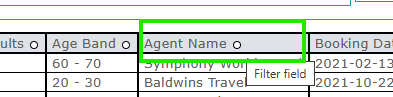
Once you've set your Dataset report exactly how you'd like you can Export or Save
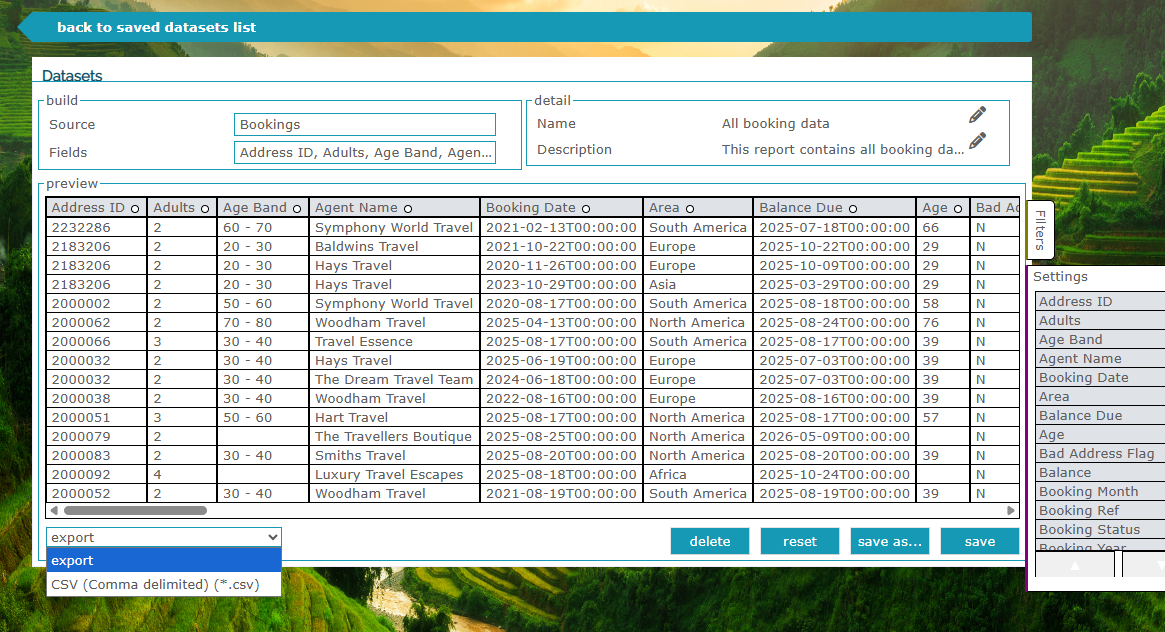
All Dataset reports are saved in the main Dataset List - you can then update them as needed, and also edit them and save as a new report, so that one report can be used for several purposes.
Crosstabs Reports
These reports are created in the same way as a Pivot Table in Excel - so you can take data from Radar and then pivot it, allowing you to summarise and analyse data. For example, if you'd like total bookings for each month of each year, or total bookings for each destination.
This then allows you to have that report created, without exporting all of the data from a Dataset report AND THEN pivoting it yourself, aggregating the data on your behalf.
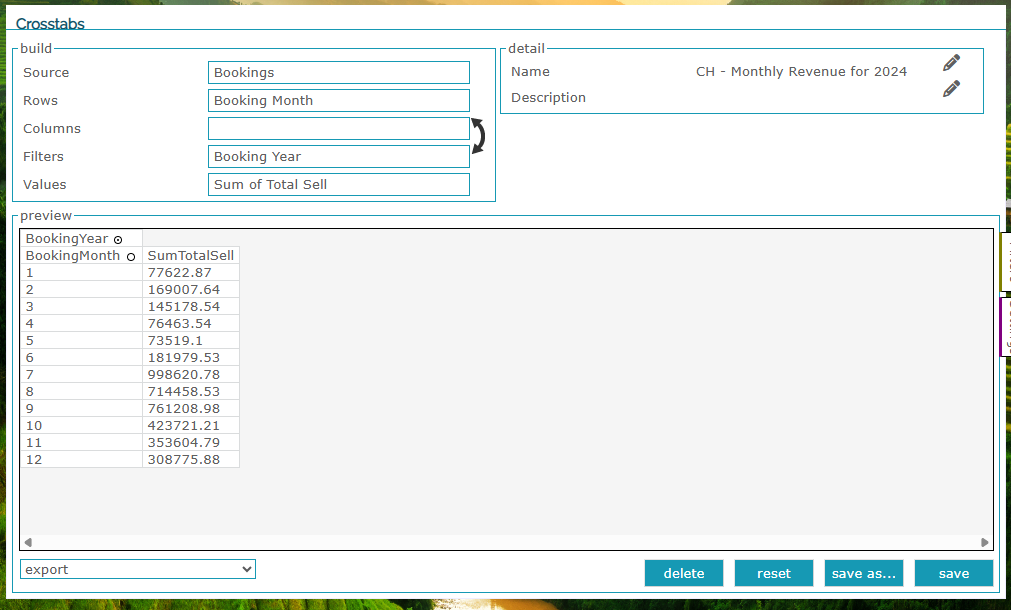
These can be as simple as creating a report for one specific piece of data - this example is Revenue by Month for 2024:
Or more complex analysis with more lines of data - this example is All Booking Data for each Destination Country for each year, to understand how booking trends are changing:
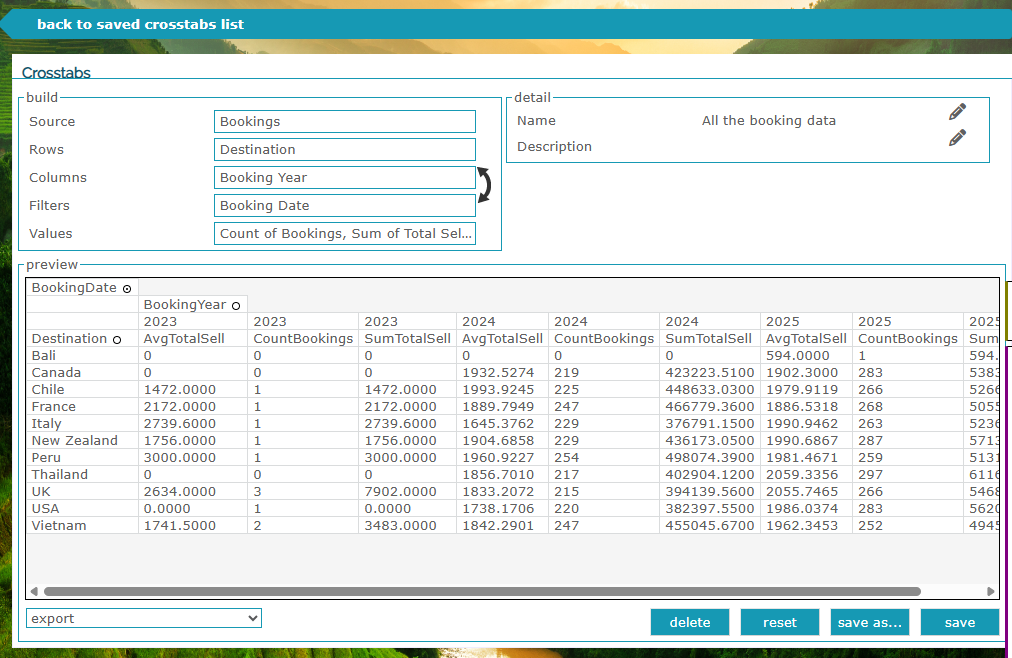
These reports allow you to get a greater overview of how your business is performing and where opportunities might lie for marketing.
Creating a Report in Crosstabs
In the same way as a Dataset report, you simply click on ...or create a new one in the bottom righthand corner, and a new report will be created. You can then choose your Source data from the list. As with traditional pivot tables, you can play around with the data, but it is really helpful if you have an idea of what you are looking to achieve with each report.
Once you know what data you'd like, you can add the Values you need, then how you'd like to understand that data - ie totals/month/year data in Columns. The data report can be viewed immediately, so that you can understand exactly what is being created, and how you might need to shift some data around, to work as needed for that particular report.
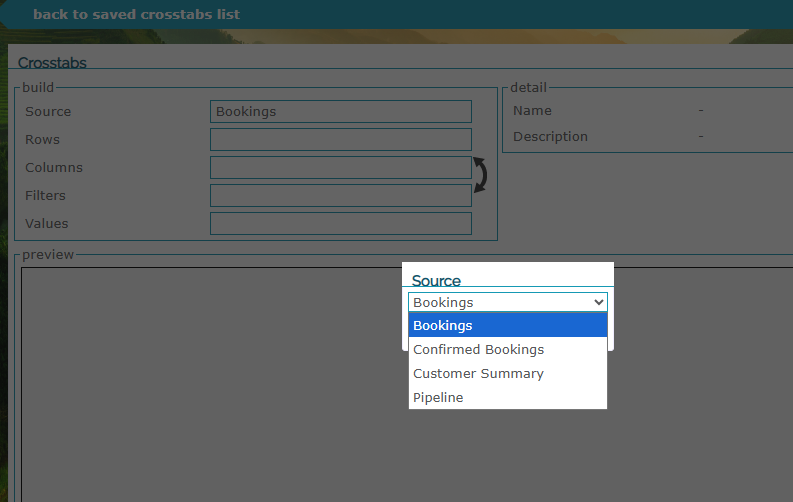
Take your Source Data:
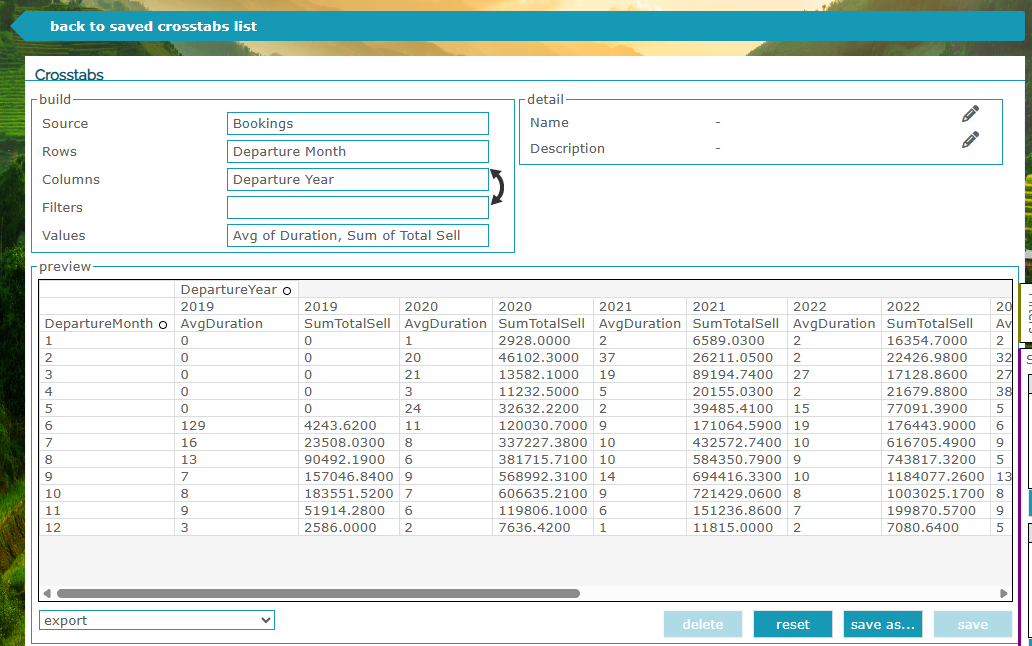
Add the Values you'd like to use (in this example I am trying to understand the AV holiday duration and total revenue by month/year) so I use Avg Duration and Sum of Total Sell, then how I'd like to see the AV duration and total REV in Rows and Columns (by Departure Month and Departure Year):
As with Datasets, you can Export this data, or Save as a new report. You can also use existing reports and Save As... to create an amended report.
Needing New Data
If the data you are looking for doesn't appear to be available in Datasets or Crosstabs, please raise a ticket within Freshdesk and we can advise on whether this needs to be added.
Likewise, if you need any help at all with report creation, please ask our team and we can advise further or create something on your behalf!
Was this article helpful?
That’s Great!
Thank you for your feedback
Sorry! We couldn't be helpful
Thank you for your feedback
Feedback sent
We appreciate your effort and will try to fix the article